In recent years, there has been a noticeable surge in individuals embarking on new business ventures. This uptick began in mid-2020, spurred by various factors, including record-low interest rates, increased reliance on digital tools, and changes in workforce dynamics. While subsequent interest rate hikes have cooled many aspects of the economy, they’ve had little effect on new business formations, which remain at near-record highs. Consequently, more individuals are exploring opportunities in entrepreneurship, but many lack visibility into how much these new business ventures might actually earn.
To help prospective business owners better understand their earning potential, Flippa—the largest online marketplace for buying and selling businesses—analyzed its internal data of more than 25,000 profitable businesses listed on its platform over the past two years. Below is a breakdown of the findings.
Revenue by Business Type
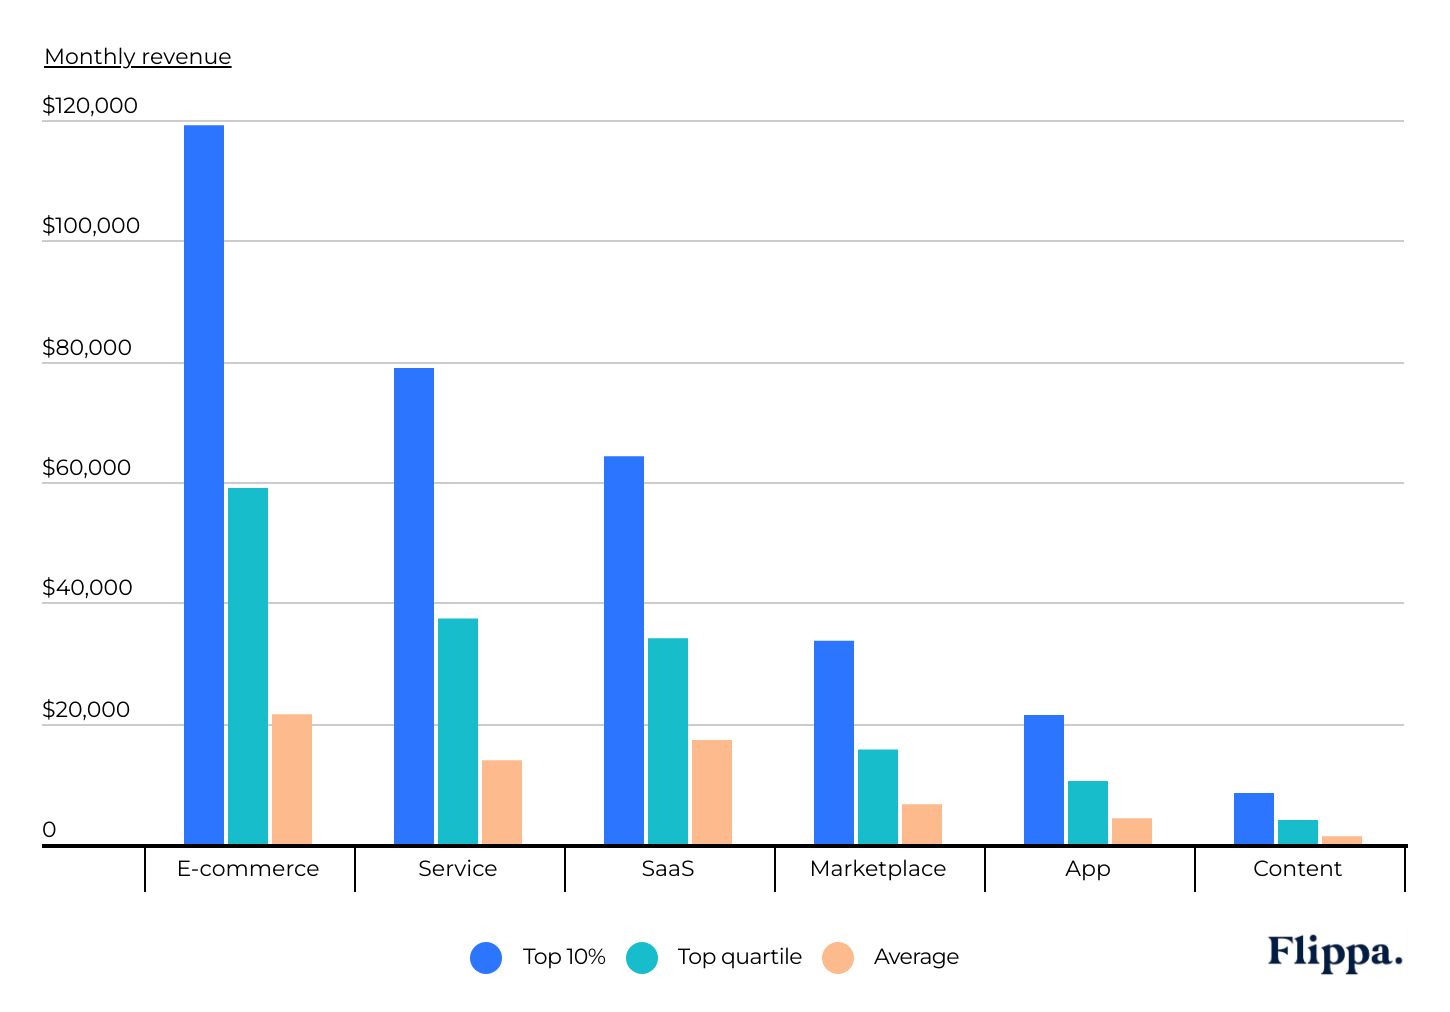
E-commerce, service, and SaaS businesses generate the highest revenues

Source: Flippa marketplace listings 3+ years old (2022–2024) | Image Credit: Flippa
Financial performance of online businesses varies significantly by business type. E-commerce, service-oriented, and Software-as-a-Service (SaaS) businesses tend to be the top earners when compared to marketplace, mobile app, and content-based ventures. For instance, mature e-commerce businesses boast an average monthly revenue of $21,497, with the top quartile reaching $59,021 and the top 10% achieving an impressive $119,141.
The success of e-commerce businesses in recent years can be attributed to several factors. First, the widespread consumer shift towards online shopping, particularly accelerated by the pandemic, has fueled demand for e-commerce platforms. Additionally, new order fulfillment methods—like Fulfillment by Amazon—and advances in digital marketing strategies have improved the scalability offered by e-commerce business models.
Similarly, service-oriented and SaaS businesses report considerable revenue, with an average monthly income of $13,898 and $17,252 for mature ventures, respectively. These businesses thrive on providing specialized products and services tailored to meet specific customer needs. The specificity and personalized nature of these offerings often lead to higher price points and recurring revenue streams, bolstering financial performance over time.
In contrast, marketplace, mobile app, and content-based businesses face greater challenges in revenue generation. Marketplaces often struggle with achieving scale due to intense competition and the need for significant investments in platform development and user acquisition. Mobile apps encounter hurdles in monetization, with a saturated market and users’ reluctance to pay for app downloads or in-app purchases. Similarly, content-based businesses also face monetization challenges, as revenue streams primarily rely on advertising or subscription models, which may not always translate into substantial earnings. In addition, sharp swings in organic traffic resulting from Google algorithm changes can lead to inconsistent revenue growth.
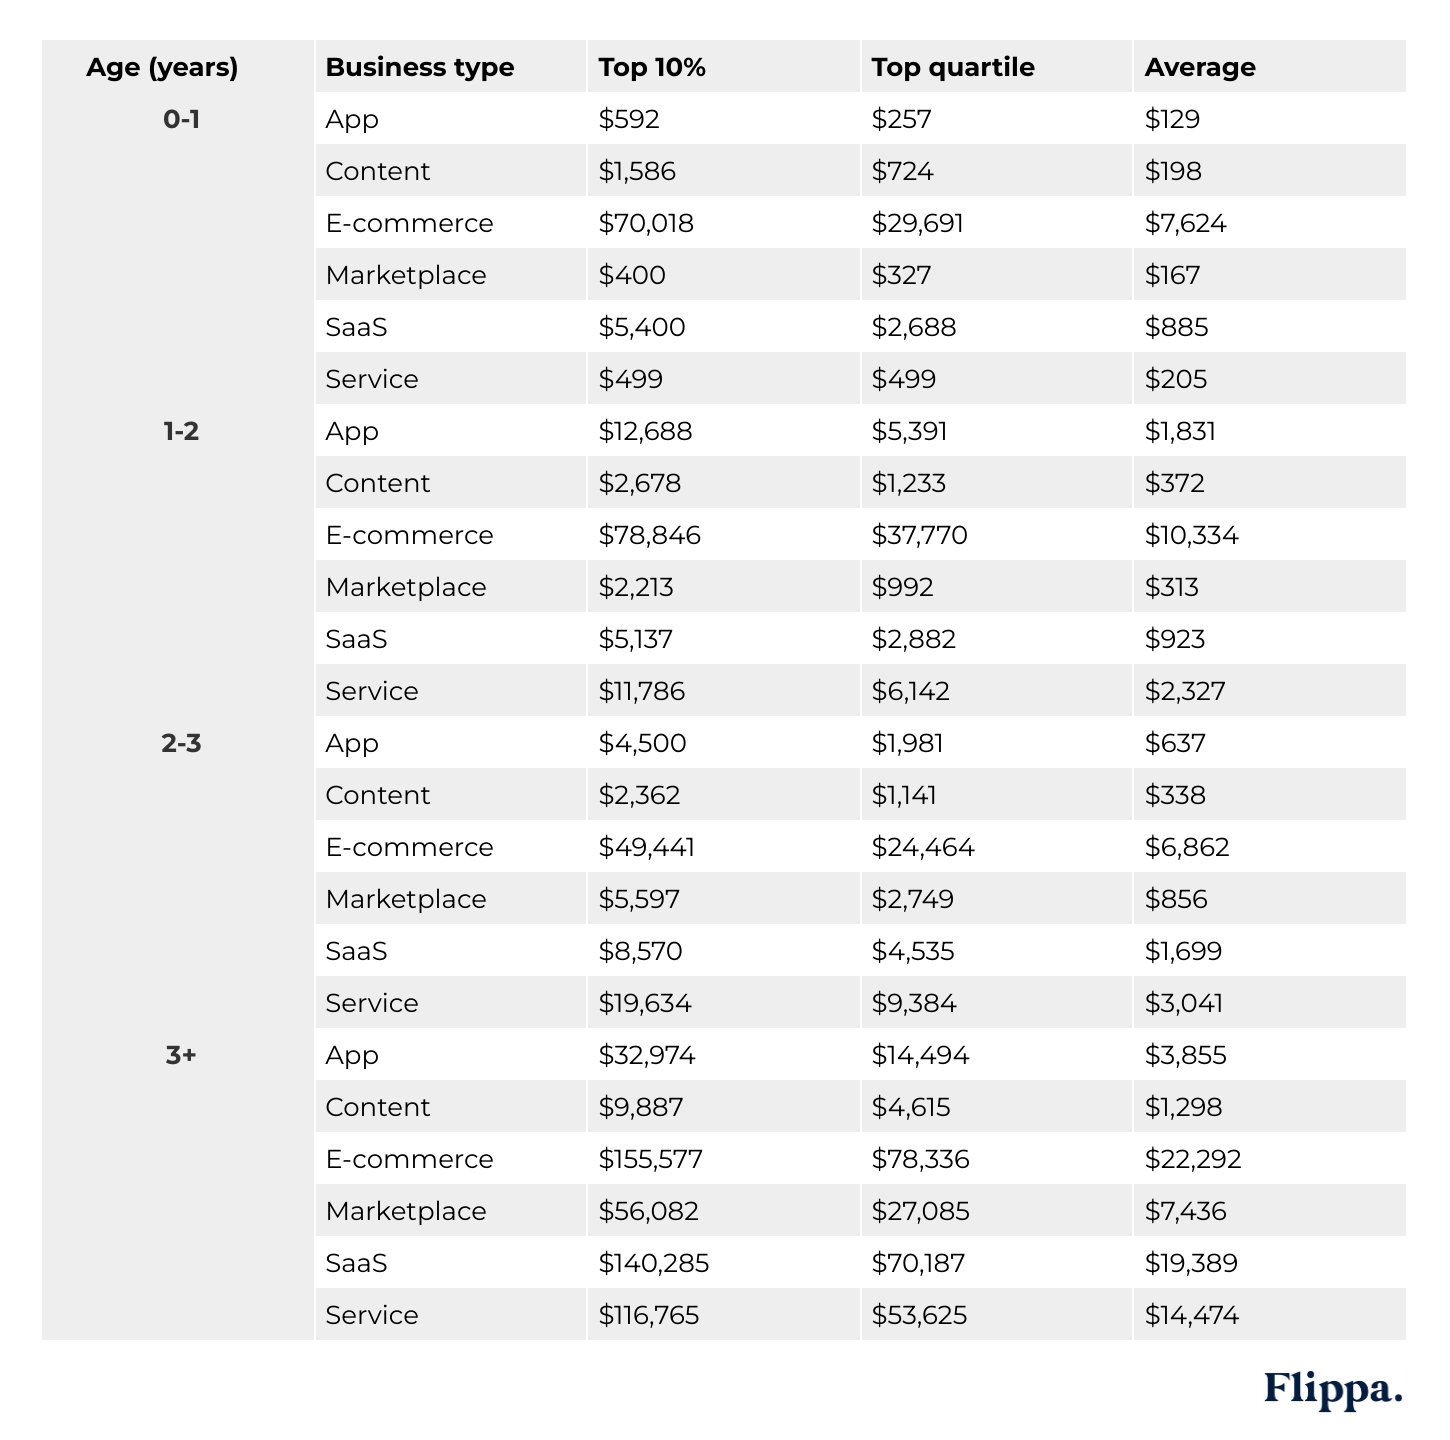
Below is a complete breakdown of average monthly revenue by business age and business type. Monthly revenue for the top quartile and top 10% of businesses are also listed for context.
Average Monthly Revenue by Business Age & Business Type
Revenues tend to increase as businesses age

Source: Flippa marketplace listings (2022–2024) | Image Credit: Flippa
Top Countries by Business Revenue
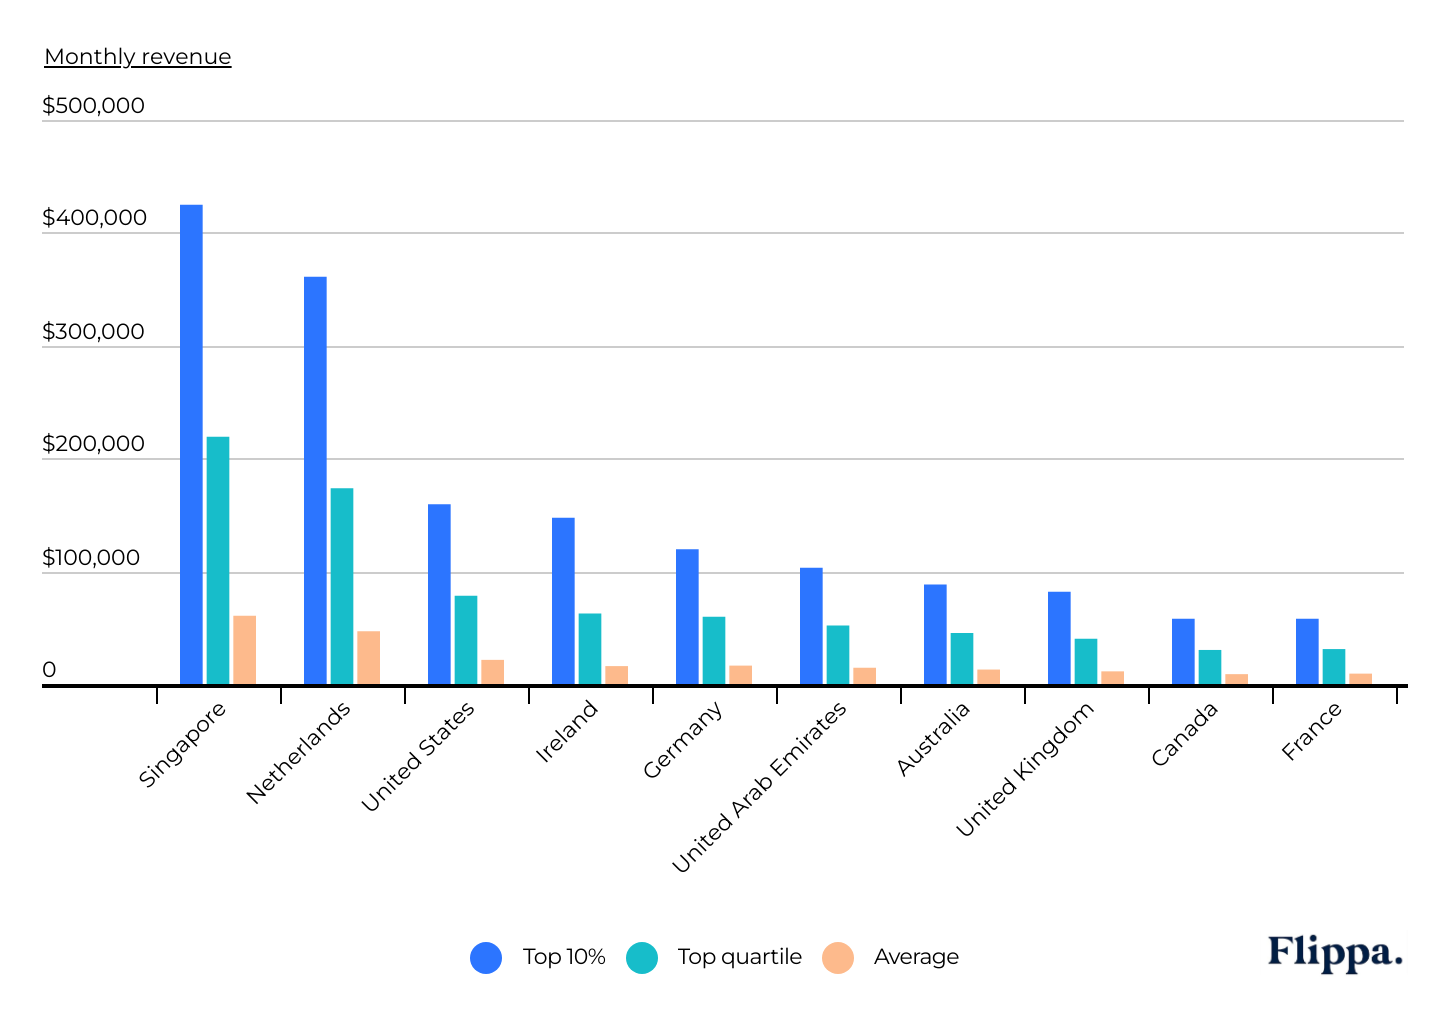
Online businesses based in Singapore and the Netherlands report the highest revenue figures

Source: Flippa marketplace listings 3+ years old (2022–2024) | Image Credit: Flippa
The countries reporting the highest average revenue figures for online businesses are diverse, spanning Asia (Singapore), Europe (the Netherlands, Ireland, Germany, the United Kingdom, and France), North America (the United States and Canada), the Middle East (United Arab Emirates), and Oceania (Australia). Notably, Singapore stands out as the global leader in financial performance for online businesses, with $60,552, $219,085, and $424,926 in revenue for the average, top quartile, and top 10% of mature businesses, respectively. Singapore has recently become a top destination for tech companies expanding into Asia. According to the Singapore Economic Development Board, 80 of the world’s top 100 technology firms now have a presence there.
Along with Singapore, the top-performing nations by average business revenue tend to benefit from robust digital infrastructures, favorable regulatory environments, and high levels of tech adoption. Relative to the global average, these countries also have high concentrations of e-commerce and SaaS businesses. In contrast, countries with lower average revenue typically exhibit a lower concentration of e-commerce and SaaS businesses and are often constrained by factors like limited access to technology infrastructure, lower levels of technology use, and more challenging economic conditions.
Top U.S. States and Territories by Business Revenue
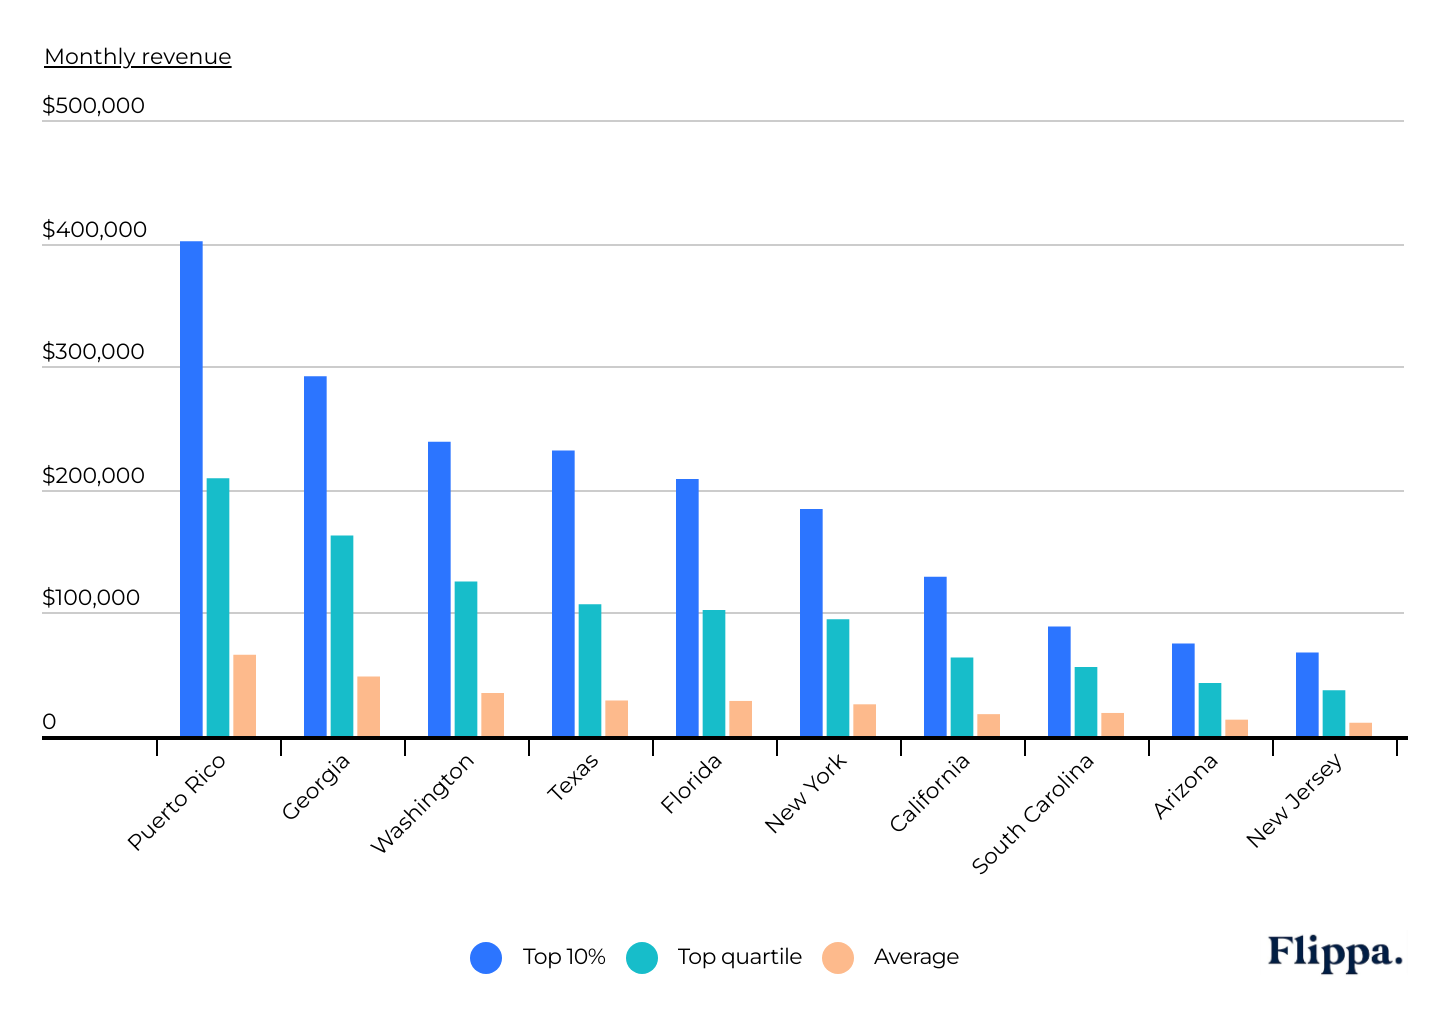
The top-performing online businesses are based in Puerto Rico

Source: Flippa marketplace listings 3+ years old (2022–2024) | Image Credit: Flippa
Within the U.S., average revenues for online businesses range widely. Among the top 10 states by average revenue are several states one might expect, including prominent technology and economic hubs like California, New York, Texas, and Washington. However, the most notable insight is that Puerto Rico tops the list, reporting average revenues of $65,975, $209,124, and $401,644, respectively, for the average, top quartile, and top 10% of mature businesses.
Puerto Rico has attracted a large influx of online technology companies over the past decade due to the implementation of attractive tax incentives and economic development programs aimed at enticing businesses to establish operations on the island. As a territory, Puerto Rico and its residents benefit from distinct tax advantages, different from the federal tax laws applicable in other states. Because of this, Puerto Rico has been able to create tax breaks and exemptions tailored for eligible businesses—like technology and software companies—and their owners who choose to relocate there. Notably, Acts 20 and 22, known as the Exported Services Act and the Individual Investors Act, cap the corporate tax rate at 4% and provide a 100% exemption on interest, dividend, and profit distributions. These incentives have allowed Puerto Rico to attract a high concentration of high-earning businesses to the island.
In addition to Puerto Rico, Georgia stands out as a top-performing state for business financial performance. Known informally as the “Tech Capital of the South,” Georgia has become a top destination for fintech and payment companies—with an estimated 70% of all U.S. transactions handled by payment processors located in the state—as well as cybersecurity, healthcare tech, and e-commerce. With a high concentration of SaaS and e-commerce companies, Georgia reports higher average revenues for its online businesses than every state outside of Puerto Rico.
Methodology

Photo Credit: Jacob Lund / Shutterstock
The statistics presented in this study represent profitable businesses listed on the Flippa Marketplace between January 2022 and present. All figures shown are monthly.
For complete results, see How Much Do Online Business Owners Make? on Flippa.


